Stack Overflow Data Visualizations

Stack Overflow Data Visualizations

Explore the data behind the world's
most popular developer destination.

  • Explore

Tag Bubble Chart

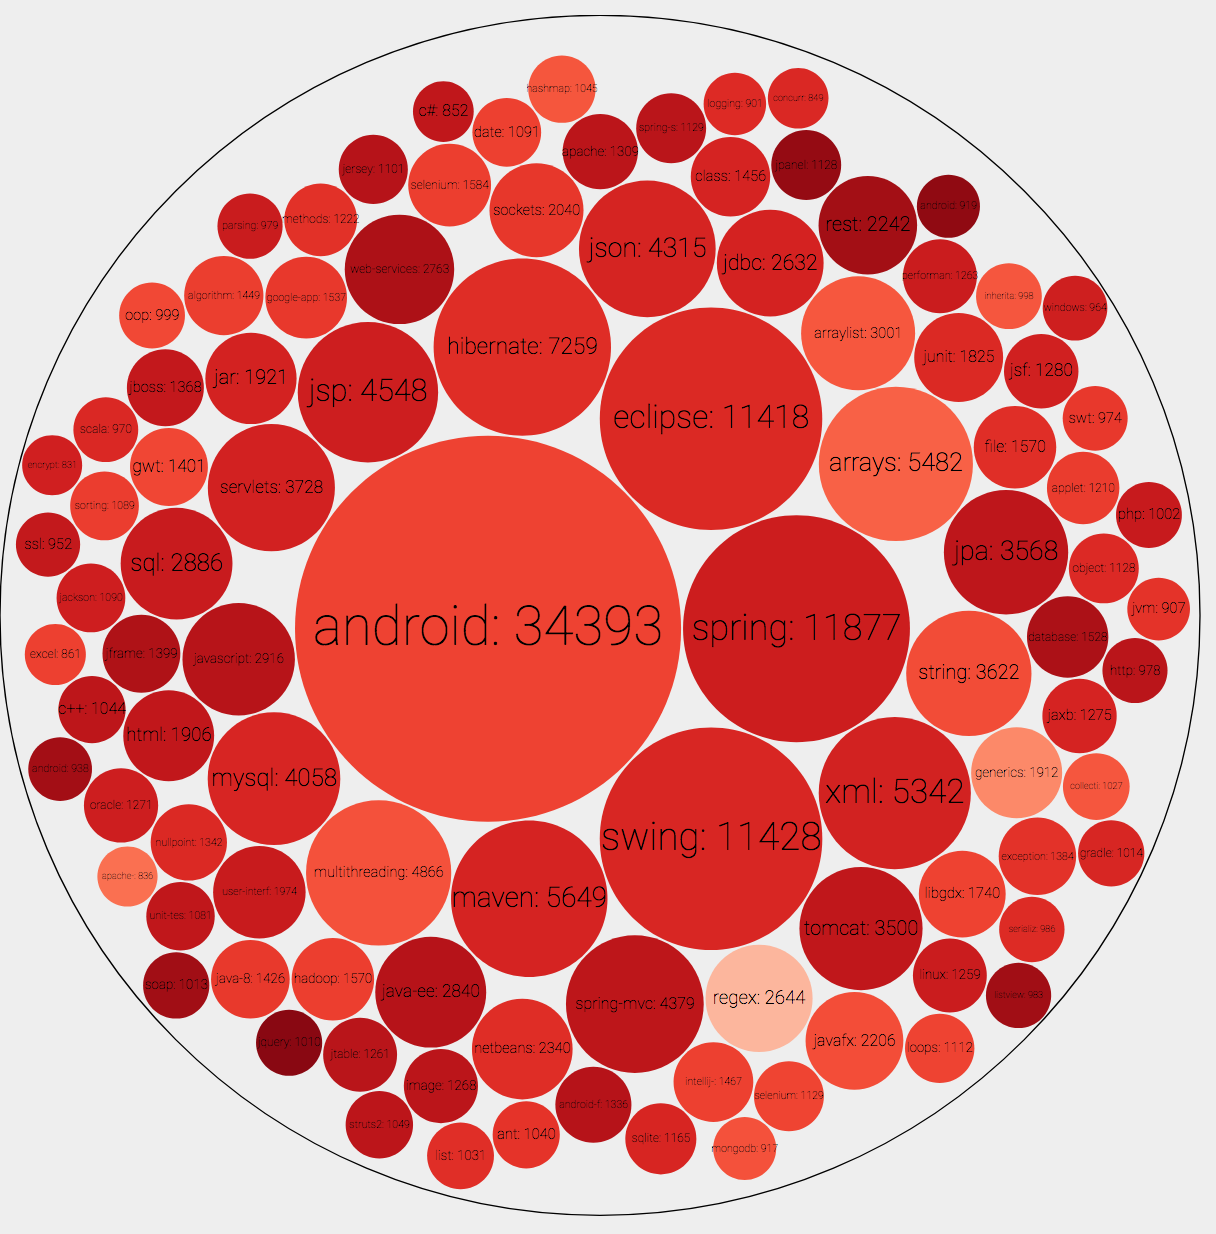
The Influence of Tags

Question Traffic HeatMap Clock

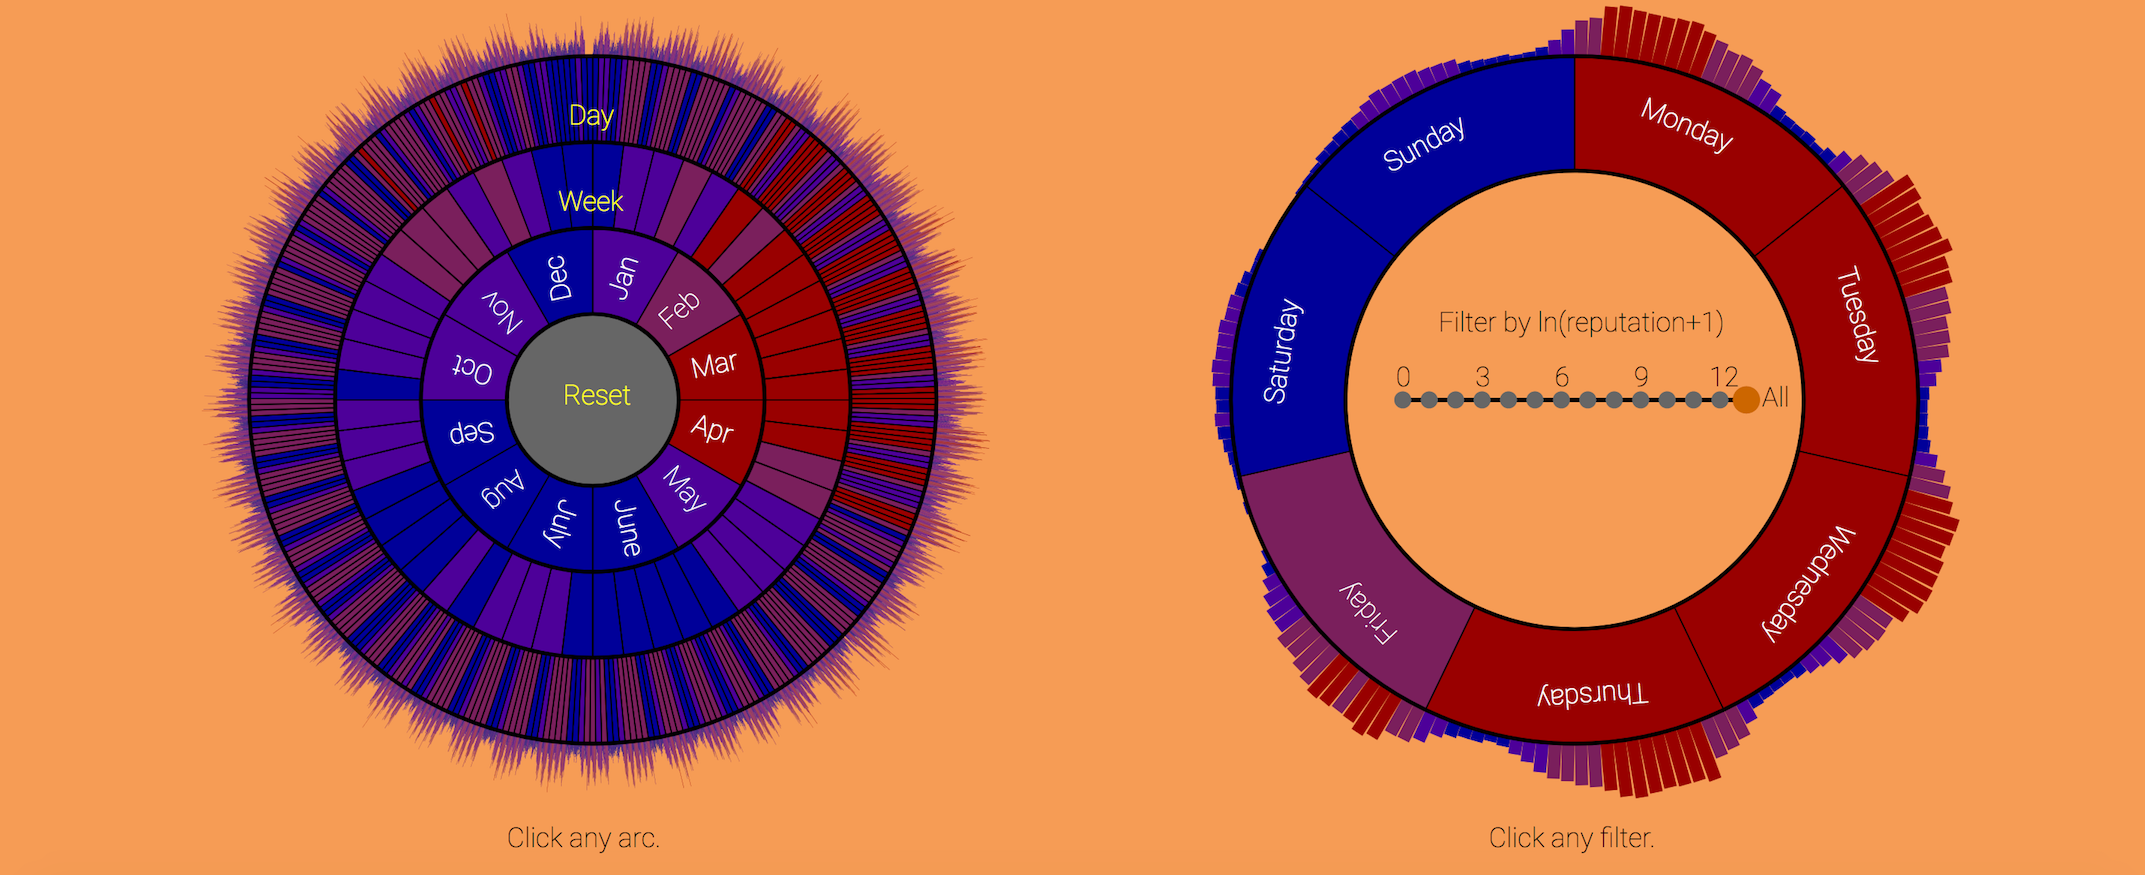
User Activity Trends

Emotional Textual StreamGraph

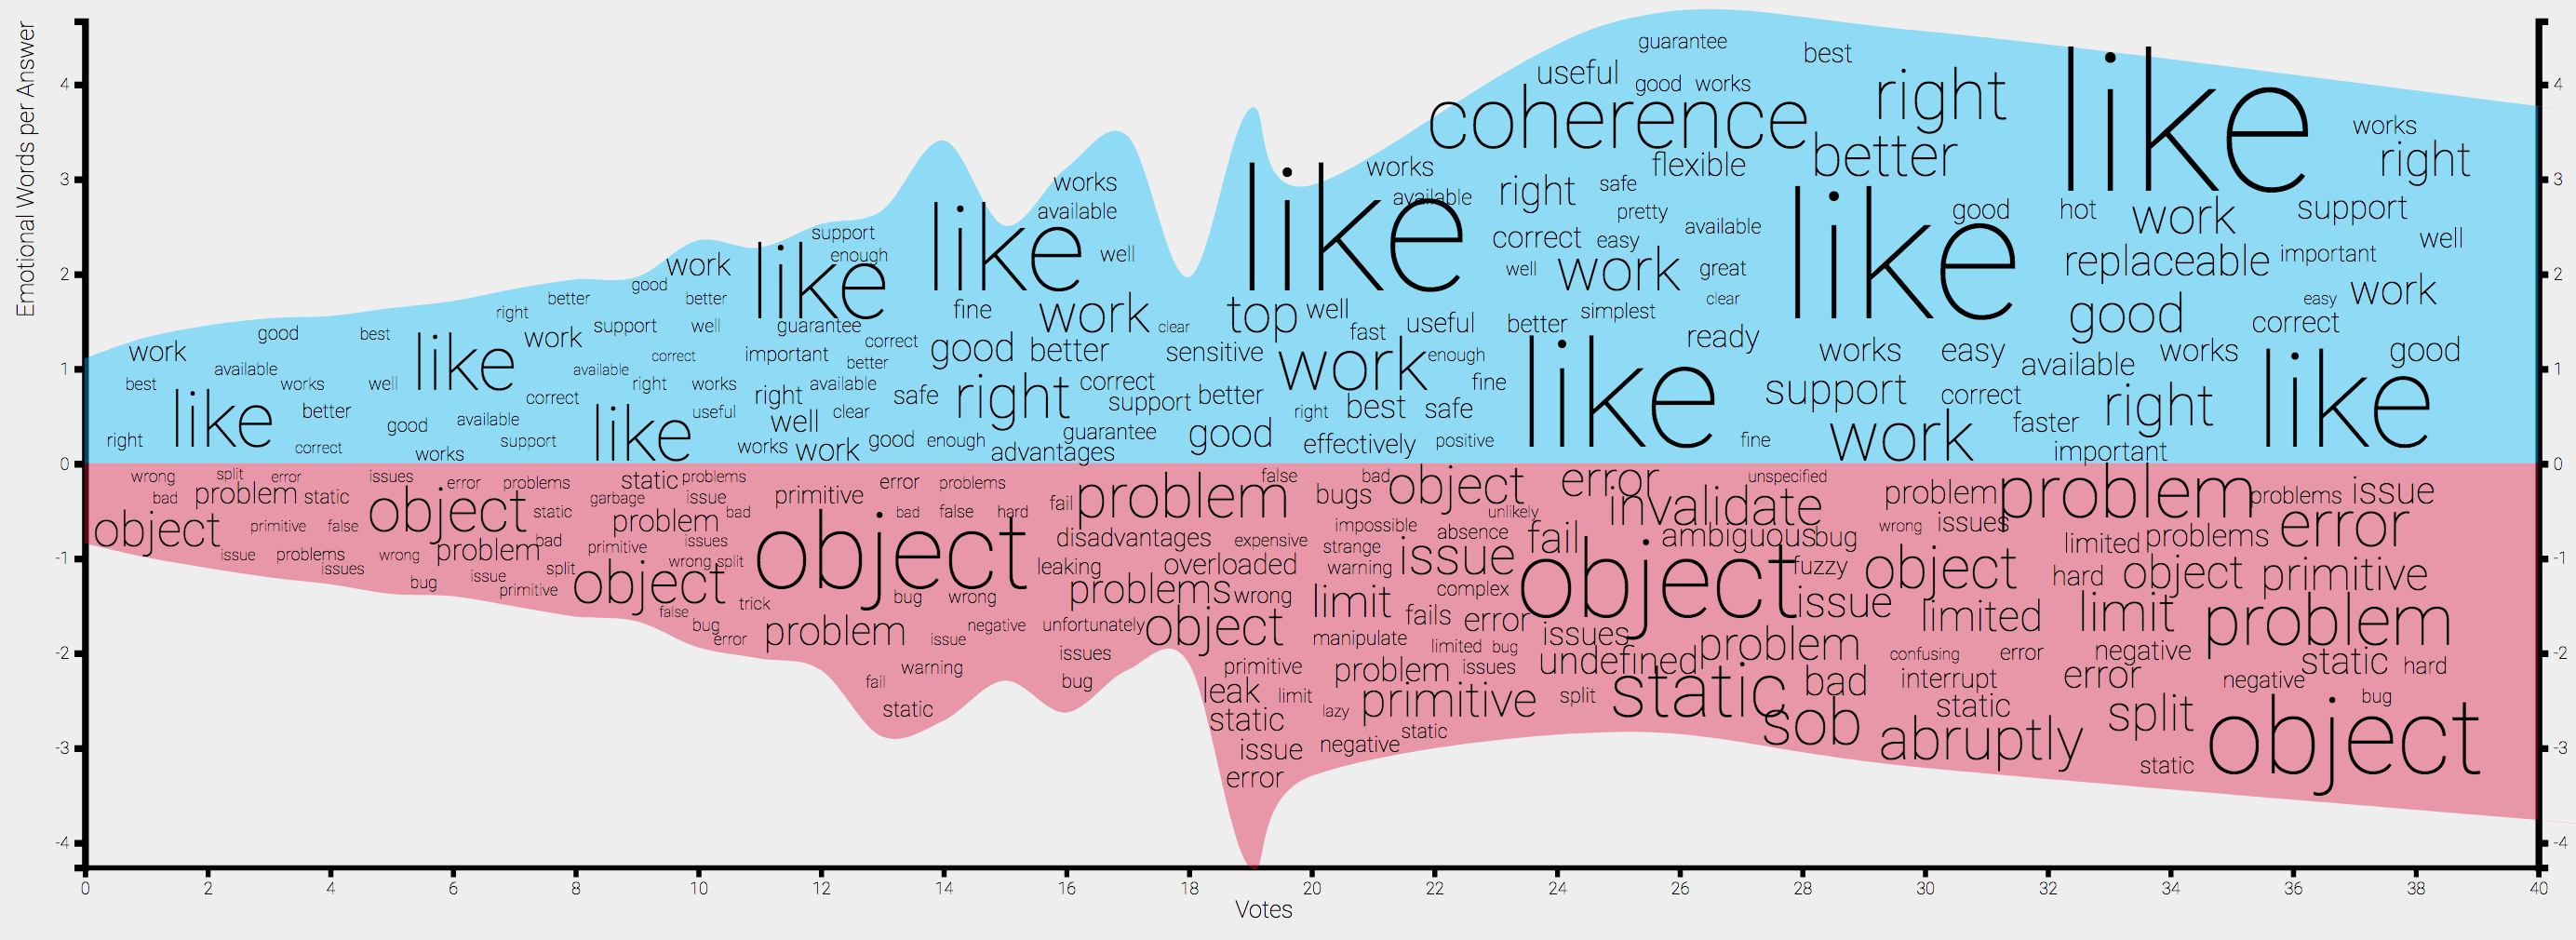
The Power of Positivity

Attribute Histograms

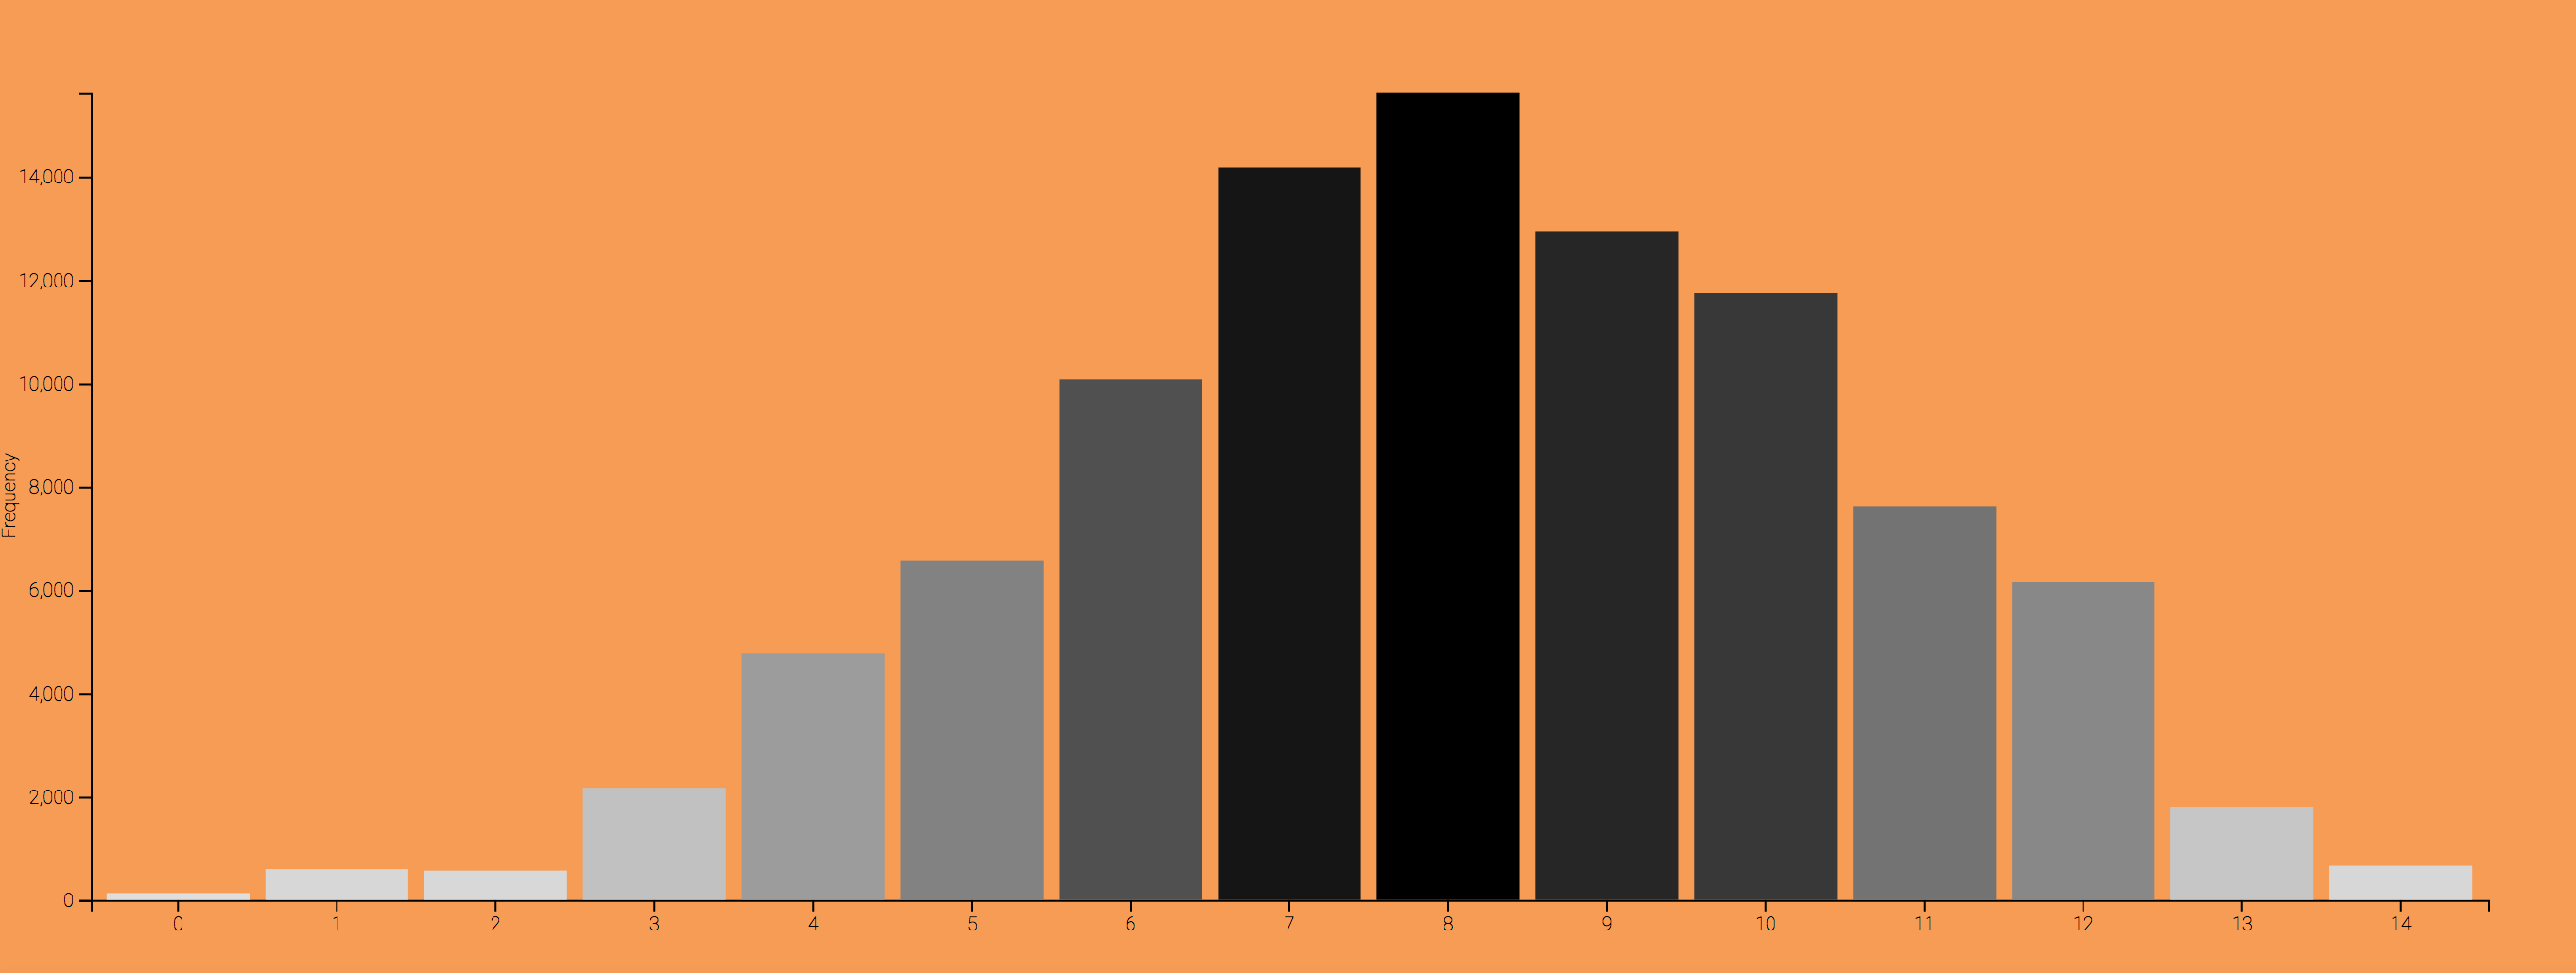
Stack Overflow Success

  • Arizona State University - CSE 578 (Data Visualization - Sharon Hsiao)

    © Tarek Salama | Alisa Pinchuk | Dan Gannon